The Big Question
What happens when your manufacturing equipment generates millions of sensor readings per second, but sending all that data to the cloud is too expensive and too slow? When a self-driving car needs to make a split-second decision without waiting for a round-trip to a data center? When an oil rig in a remote location has limited bandwidth but critical equipment that needs constant monitoring?
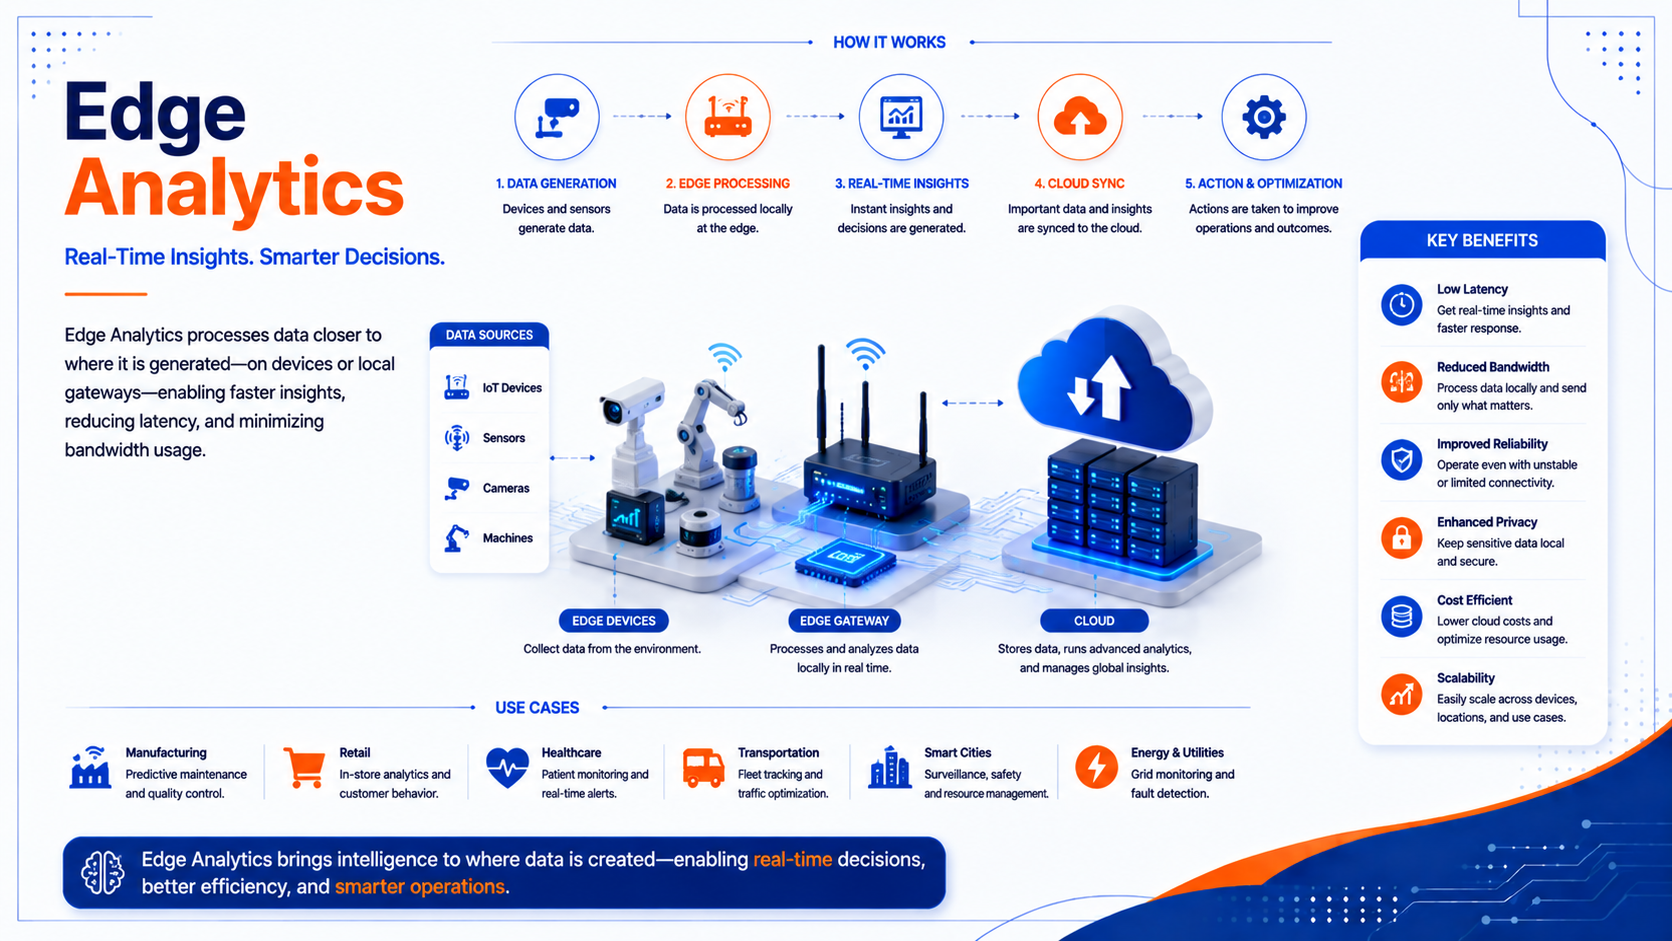
Edge analytics answers these questions by processing data where it's created at the sensor, the machine, or the network edge. This isn't just about efficiency; it's about enabling entirely new classes of applications that require real-time intelligence.
What Is Edge Analytics?
Edge analytics is the practice of performing automated analytical computation on data at the source a sensor, network switch, or other edge device rather than waiting for that data to be sent to a centralized data store for processing. It brings computational resources (processing, storage, and networking) to the close proximity of edge devices where data is produced and consumed.
The distinction from traditional cloud analytics is fundamental: edge analytics processes data locally, sending only insights or summaries to the cloud, rather than transmitting raw data streams. This approach is becoming increasingly critical as the Internet of Things (IoT) model expands across industries.
Key Benefits of Edge Analytics
Reduced Latency and Faster Decisions
Data is analyzed closer to its source, making decisions far more agile. In time-sensitive environments like manufacturing floors, oil rigs, or autonomous vehicles, edge analytics enables decisions to be made in milliseconds rather than seconds or minutes. As one analysis puts it, "edge is here and now".
Lower Operational and Storage Costs
Not all data is equally valuable. With edge analytics, there's no need to store everything "in the hope that one day it might be useful". For example, a self-driving car doesn't need to transmit data when everything is running fine only anomalies or insights need to be sent to the cloud. This selective processing dramatically reduces both storage and bandwidth costs.
Works in Low-Bandwidth Environments
Some IoT environments like oil wells, connected vehicles, and remote industrial sites generate such massive data volumes that they can overwhelm available bandwidth. By performing analytics at the edge, organizations reduce the data that must traverse the network, making deployments viable even in bandwidth-constrained locations.
Linear Scalability
As IoT deployments grow, the number of sensors and devices increases exponentially and so does the strain on central analytics resources. Edge analytics architectures can scale linearly with IoT growth because processing power scales with the distributed infrastructure rather than creating a single centralized bottleneck.
Cost-Effective Reliability
Edge analytics provides a cost-effective solution for distributed environments. If a failure occurs in the analytics system, recovery is generally faster even in remote locations. Equipment failure can be avoided through predictive maintenance performed when needed, rather than on a fixed schedule.
Lower Inventory Costs
Maintenance crews gain earlier and more precise visibility into future failures and breakdowns, making spare parts inventory vastly more efficient. This reduces carrying costs while ensuring critical parts are available when needed.
How Edge Analytics Works in Practice
The Processing Pipeline
Modern edge analytics platforms process data through a three-stage pipeline where data flows through a series of processors. Each data operation from unit conversion to anomaly detection to AI inference is expressed consistently within the platform, enabling both no-code configuration and custom logic when needed.
Pre-Configured KPI Processors
Industrial teams can avoid weeks of custom code development by using pre-configured KPI processors. Common operational metrics that can be generated out-of-the-box include:
| KPI Type | What It Tracks |
|---|---|
| Online/Offline Percentage | How long a sensor or device was functional vs. offline |
| Uptime/Downtime | Compares current tag values against desired values |
| Production Cycle & CTR | Actual production time against an ideal cycle time |
| Manufacture Count & Utilization | Total units manufactured vs. capacity |
| Maintenance & Failure | Time since last maintenance, faults detected |
| Compliance & Loss | Quality yield metrics per production cycle |
These KPIs address the four pillars of OEE-style monitoring availability, performance, quality, and maintenance without requiring custom calculation logic.
Statistical Functions and Signal Processing
Beyond pre-built KPIs, edge analytics platforms offer extensive statistical function libraries for more sophisticated analysis:
-
Signal Processing: Gaussian filters for noise removal, signal decomposition, normalization, and unit conversions
-
Pattern Detection: Rise/fall detection, moving window calculations, linear and statistical prediction
-
Statistical Tests: Distribution tests (Jarque-Bera, Cramér-von Mises), Statistical Process Control charts
-
Feature Engineering: Feature extraction for downstream ML pipelines, conditional data routing
AI and ML at the Edge
Edge analytics platforms now treat AI inference as a first-class processor type not a separate system or cloud call. TensorFlow models can be loaded directly into an analytics flow and run locally at inference time. This supports classification, regression, and anomaly detection workflows on streaming operational data without any cloud dependency.
Small Language Models (SLMs) and Large Language Models (LLMs) can also be embedded directly in operational workflows through purpose-built AI processors.
Industries and Applications
Edge analytics is finding applications across sectors:
| Industry | Applications |
|---|---|
| Manufacturing | Predictive maintenance, process optimization, quality monitoring |
| Energy & Utilities | Smart metering, grid optimization, oil and gas monitoring |
| Transportation | Fleet management, condition monitoring, autonomous vehicles |
| Healthcare | Connected care, remote patient monitoring, equipment tracking |
| Retail | Real-time customer insights, inventory management, operational efficiency |
Manufacturing and Industrial IoT
Edge analytics is particularly significant in manufacturing. In industrial environments, streaming data from manufacturing machines and industrial equipment creates a massive volume of operational data. Preprocessing and analysis at the edge offers both cost benefits and latency reduction.
Condition monitoring used for predictive maintenance of machines, processes, and entire facilities aims to avoid unplanned downtime and increase production line availability. Sensors monitor parameters like temperature, speed, torque, vibration, pressure, and current. Vibration analysis, in particular, provides critical information about machine load and the progression of faults.
Smart Fleet and Transportation
Transportation companies leveraging IoT for fleet management are driving edge analytics adoption. Real-time monitoring of vehicle conditions, driver behavior, and route optimization all benefit from low-latency processing at the edge.
Market Outlook and Challenges
The Global Edge Analytics Market was valued at $9 billion in 2024 and is expected to reach $28.5 billion by 2031, growing at a CAGR of 17.5%. Key drivers include the increasing adoption of IoT devices, the need for real-time data processing, and advancements in machine learning and AI technologies.
Key Challenges
Despite its promise, edge analytics faces several constraints:
-
Limited Resources: Edge devices often have limited power supply, small memory, and constrained processing capabilities, making it difficult to execute advanced analytic algorithms
-
Data Security and Privacy: Processing data at distributed edges creates security challenges
-
Integration Complexity: Connecting edge analytics with existing systems remains difficult
-
Skill Shortages: Organizations need skilled professionals to manage and analyze edge data effectively
Implementation Roadmap
Phase 1: Foundation (Weeks 1-4)
-
Audit your data streams: Identify which data sources generate the most volume and where latency is most critical
-
Define your edge use case: Start with one high-value application predictive maintenance or condition monitoring
-
Select your edge platform: Evaluate Litmus Edge, Siemens Edge Analytics, or other solutions based on your requirements
Phase 2: Build Your Pipeline (Weeks 5-8)
-
Configure data ingestion: Connect sensors and devices to your edge platform
-
Deploy pre-configured KPIs: Start with out-of-the-box metrics for availability, performance, and quality
-
Set up alerting: Define thresholds and conditions for automated responses
Phase 3: Operationalize (Weeks 9-12+)
-
Enable AI models: Deploy TensorFlow models or other ML at the edge for predictive capabilities
-
Connect to cloud: Set up selective upload of insights and aggregated data to your central systems
-
Monitor and iterate: Track performance, accuracy, and business impact
Frequently Asked Questions
Q1: What is edge analytics?
Edge analytics is the practice of analyzing data at the source sensors, network switches, or edge devices rather than sending raw data to a central cloud for processing. It enables real-time decisions, reduces bandwidth costs, and improves operational efficiency.
Q2: How is edge analytics different from cloud analytics?
Cloud analytics sends all raw data to centralized data centers for processing. Edge analytics processes data locally at the edge, sending only insights or summaries to the cloud. This reduces latency, bandwidth usage, and storage costs.
Q3: What industries benefit most from edge analytics?
Manufacturing, energy and utilities, transportation, healthcare, and retail all benefit from edge analytics. Applications include predictive maintenance, fleet management, condition monitoring, and real-time operational intelligence.
Q4: Can AI run at the edge?
Yes. Edge analytics platforms now support TensorFlow models, small language models, and other AI inference directly on edge devices without cloud dependency. This enables real-time anomaly detection, classification, and prediction in operational environments.
Q5: How can Innovative AI Solutions help?
We help organizations design, build, and operationalize edge analytics strategies from use case identification and platform selection to deployment and scaling. Based in Delhi, serving clients across India.
Final Thought
The shift is clear: from sending all data to the cloud to processing intelligence at the source. Organizations that master edge analytics will be the ones that achieve real-time responsiveness, lower operational costs, and new capabilities that were previously impossible with centralized processing alone.
Contact Us:
Phone: +91 7464 099 059 / +91 9689967356
Email: info@innovativeais.com
Address: Netaji Subhash Place, Pitampura, Delhi – 110034
Website: https://innovativeais.com
About the Author
Abhishek Kumar
Founder & CEO, Innovative AI Solutions
5+ years building AI, IoT, and enterprise systems. Based in Delhi, serving clients across India.
Related services: to apply this in your business, explore our machine learning and predictive analytics and RAG development.