The Big Question
Why does finding the root cause of a production issue take so long?
It's not that teams lack data. Dashboards show CPU spikes. Logs capture errors. Alerts fire. But the data is scattered across systems, and connecting the dots requires manual effort.
41% of technology leaders cite data silos as a primary concern for observability. 43% say they struggle to integrate data from multiple sources. And 65% say they have too many tools for monitoring.
This is the gap between monitoring and observability.
Monitoring asks: "Is the system working?" It watches known metrics and alerts when thresholds are crossed. It answers questions you thought to ask in advance.
Observability asks: "Why isn't the system working?" It provides the ability to explore system state, trace requests across services, and find the root cause of unexpected behavior. It answers questions you didn't know to ask.
In distributed systems microservices, serverless, event-driven architectures the questions you need to ask are rarely the ones you predicted. Observability provides the flexibility to find answers.
The business case is direct: the median cost of downtime is $8,500 to $9,000 per minute. Faster root cause analysis means faster recovery. Faster recovery means less revenue lost, fewer customers frustrated, and less engineering time burned on firefighting.
What Software Observability Actually Means
Observability is the ability to understand the internal state of a system by examining its external outputs. The term comes from control theory a system is observable if you can determine its internal state from its outputs.
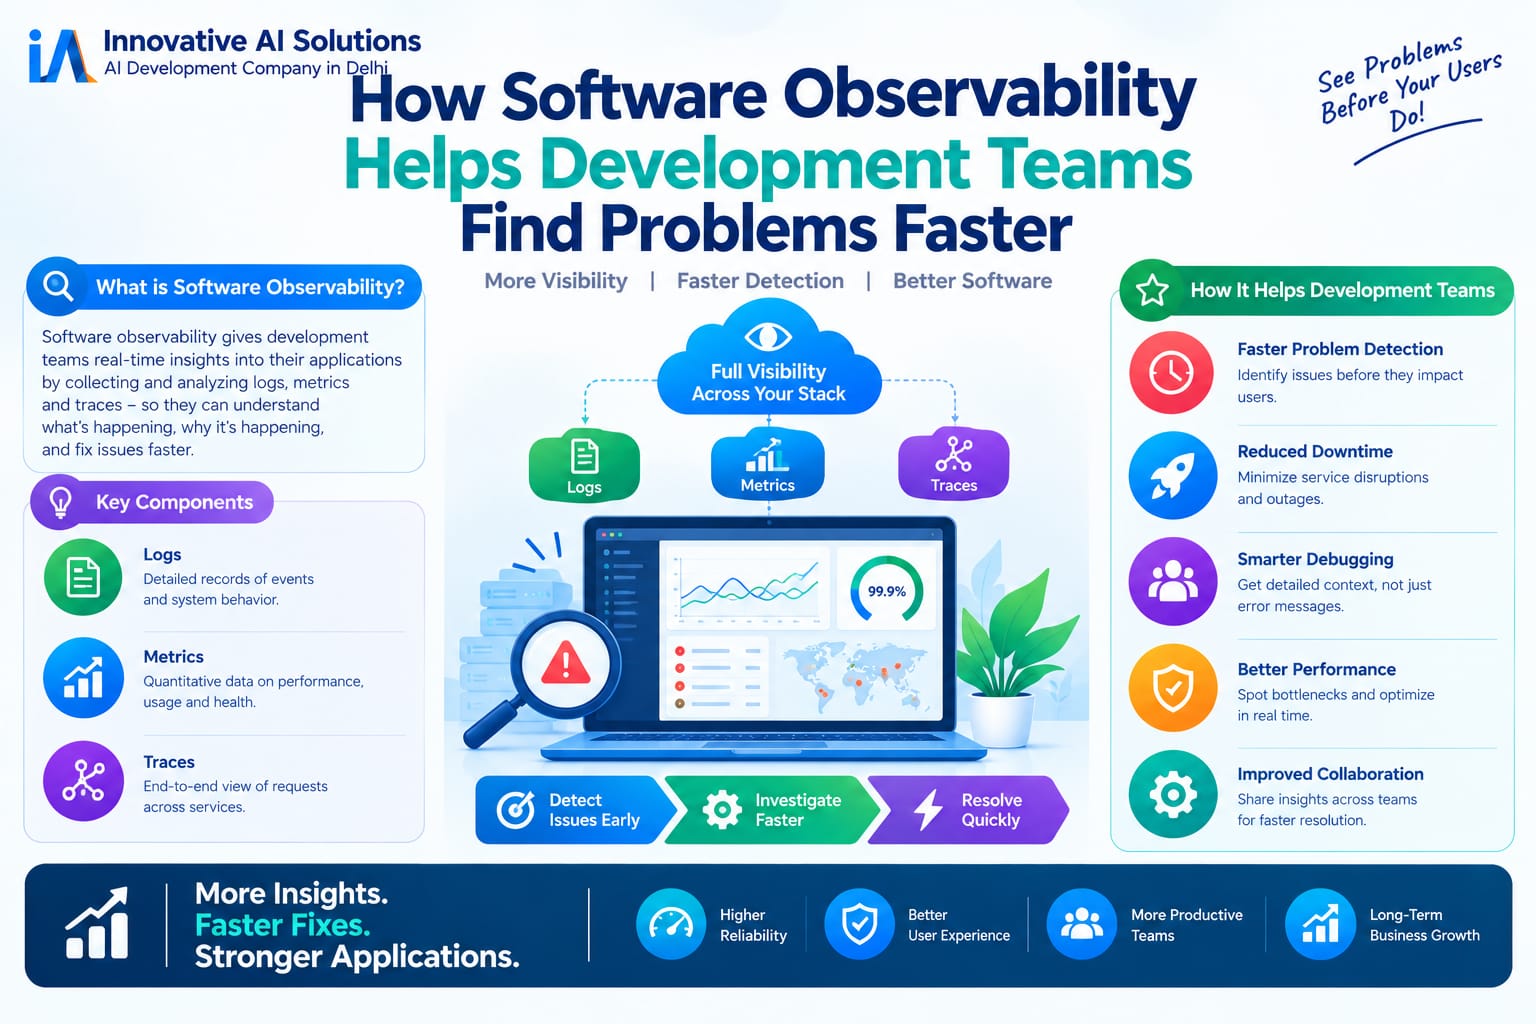
In software, observability is built on three pillars:
Metrics
Numeric measurements collected over time. CPU usage. Request latency. Error rates. Throughput. Metrics are cheap to store and fast to query. They're ideal for dashboards, alerting, and trend analysis.
Logs
Discrete events recorded by the application. Errors, warnings, informational messages. Logs provide context what happened, when, and often why. Structured logs (JSON) are searchable. Unstructured logs are harder to analyze at scale.
Traces
The journey of a single request through the system. A trace shows every service, every database call, every external API call involved in handling that request. It shows where time was spent and where errors occurred. Distributed tracing is essential for microservices.
The emerging fourth pillar: Profiles
Continuous profiling captures resource usage CPU, memory down to the function level. It shows not just that a service is slow, but which function is consuming resources. This is becoming standard for performance optimization.
The distinction from monitoring: Monitoring tracks known-unknowns. Observability surfaces unknown-unknowns. You don't know what question you'll need to ask during an incident. Observability lets you ask it.
Why Observability Matters More Than Ever
Three forces are making observability essential.
First, distributed systems are the norm. Microservices, containers, Kubernetes, serverless functions modern applications are composed of many moving parts. A single user request might touch a dozen services. Without tracing, you can't see where time is spent or where failures occur.
Second, deployment velocity has increased. CI/CD pipelines deploy multiple times per day. Each deployment changes system behavior. When something breaks, you need to correlate the change with the symptom. Observability provides that correlation.
Third, customer expectations are higher. Users don't tolerate slow or unreliable software. Mean time to detection (MTTD) and mean time to resolution (MTTR) are competitive metrics. Observability directly improves both.
The market reflects this. Observability platform spending is growing at 15-20% annually. Gartner predicts that by 2026, 70% of organizations will have adopted observability practices as a core part of their software delivery.
How Observability Helps Teams Find Problems Faster
Observability accelerates every phase of incident response.
Faster Detection
Metrics and alerts identify anomalies quickly. A spike in error rates. A drop in throughput. An increase in latency. Observability platforms correlate signals across metrics, logs, and traces to reduce noise and surface real issues.
Faster Triage
When an alert fires, the team needs to understand scope and severity. Is this affecting all users or a subset? Is it a single service or a cascading failure? Traces show the request path. Logs show errors. Metrics show the blast radius.
Faster Root Cause Analysis
This is where observability delivers the most value. Traditional debugging requires hypothesizing about what might be wrong, then checking each hypothesis. Observability lets you ask arbitrary questions. "Show me all requests from this user in the last hour." "What changed in the last deployment?" "Which service is causing the latency?"
Faster Resolution
Once the root cause is identified, the fix is usually straightforward. The hard part is finding the cause. Observability reduces MTTR by reducing the time spent searching for the problem.
The data: Organizations with mature observability practices report MTTR reductions of 50-70%. They resolve incidents faster, with less customer impact, and with less engineering time spent on firefighting.
The Three Pillars in Practice
Each pillar serves a different purpose.
Metrics: The What
Metrics tell you what is happening. Request rate. Error rate. Duration. Saturation. These are the signals that trigger alerts. They're cheap to store and fast to query. They're the starting point for investigation.
Logs: The Why
Logs tell you why something happened. An error message. A stack trace. A warning about a configuration issue. Logs provide context that metrics lack. Structured logging makes them searchable and analyzable at scale.
Traces: The Where
Traces tell you where time was spent and where errors occurred. A trace shows the complete journey of a request every service, every database call, every external API. It shows latency at each hop. It shows where the request failed.
The integration: The real power comes from connecting the pillars. Click from a metric spike to the logs during that time window. Click from a log entry to the trace that generated it. Click from a trace to the metrics for each service involved. This connected experience is what observability platforms provide.
The Cost of Observability
Observability requires investment but the cost of not having it is higher.
Observability platform costs vary by scale. Startups might spend $200-500/month** for basic observability. Growing companies spend **$2,000-10,000/month. Enterprises spend $50,000+ per month for comprehensive observability across large-scale systems.
The hidden cost: data volume. Observability costs scale with data volume. More logs, more traces, more metrics mean higher storage and processing costs. Observability data governance is becoming a discipline sampling, retention policies, and tiered storage to control costs.
The ROI: The median cost of downtime is $8,500-$9,000 per minute. A single hour of downtime costs $510,000-$540,000. If observability reduces MTTR by 50%, the savings from a single avoided hour of downtime can exceed the annual cost of the observability platform.
What This Means for Your Business
For engineering leaders:
Observability is not a tool it's a practice. Start with the three pillars. Instrument your code. Collect metrics, logs, and traces. Build dashboards. Correlate signals. The investment pays off in faster incident response and higher reliability.
For growing teams:
Observability becomes more important as systems become more distributed. Monoliths are easier to debug. Microservices require tracing. If you're moving to distributed architecture, invest in observability before you need it.
For product leaders:
Observability affects customer experience. Faster detection and resolution mean less downtime, fewer frustrated users, and higher satisfaction. Observability is a competitive advantage.
For Indian businesses:
The tools are accessible. Open-source options like Prometheus, Grafana, and Jaeger provide strong capabilities. Managed platforms like New Relic, Datadog, and Dynatrace have strong India presence. Start with the pillars. Build from there.
Frequently Asked Questions
Q1: What is software observability?
Software observability is the ability to understand the internal state of a system by examining its external outputs metrics, logs, and traces. It provides the ability to ask arbitrary questions about system behavior without deploying new code.
Q2: How is observability different from monitoring?
Monitoring tracks known metrics and alerts when thresholds are crossed. It answers questions you predicted in advance. Observability lets you explore system state and find root causes of unexpected behavior. It answers questions you didn't know to ask.
Q3: What are the three pillars of observability?
Metrics (numeric measurements over time), logs (discrete events), and traces (the journey of a request through the system). Profiles continuous resource usage down to the function level are emerging as a fourth pillar.
Q4: How does observability help find problems faster?
Faster detection (anomaly alerts), faster triage (scope and severity), faster root cause analysis (arbitrary questions), and faster resolution. Organizations with mature observability report MTTR reductions of 50-70%.
Q5: How much does observability cost?
Startups: $200-500/month**. Growing companies: **$2,000-10,000/month. Enterprises: $50,000+/month. Costs scale with data volume log and trace governance is essential for cost control.
Q6: What is distributed tracing?
Distributed tracing follows a single request through multiple services. It shows every service, database call, and external API involved. It shows latency at each hop and where errors occurred. It's essential for microservices.
Q7: What is the ROI of observability?
The median cost of downtime is $8,500-$9,000 per minute. A single avoided hour of downtime saves $510,000-$540,000. If observability reduces MTTR by 50%, the savings can exceed the annual platform cost.
Q8: What is the difference between logs, metrics, and traces?
Metrics: Numeric measurements (CPU, latency, error rate). Logs: Discrete events (errors, warnings). Traces: Request journeys across services. Each serves a different purpose. Together, they provide complete visibility.
Q9: What is observability data governance?
Managing observability data volume through sampling, retention policies, and tiered storage. Not all data needs to be retained at full fidelity. Governance keeps costs manageable while preserving the ability to investigate incidents.
Q10: What tools are used for observability?
Open-source: Prometheus, Grafana, Jaeger, OpenTelemetry. Commercial: New Relic, Datadog, Dynatrace, Splunk. The choice depends on scale, budget, and existing infrastructure.
Frequently Asked Questions (Continued)
Q11: What is OpenTelemetry?
An open-source standard for instrumenting applications to generate telemetry data metrics, logs, and traces. It provides vendor-neutral APIs and SDKs, allowing you to switch observability platforms without re-instrumenting your code.
Q12: How do I get started with observability?
Start with metrics. Instrument your application to expose key metrics. Add structured logging. Add distributed tracing for critical paths. Correlate the pillars. Build dashboards. Iterate.
Q13: What is the biggest mistake in observability adoption?
Collecting too much data without governance. Observability costs scale with data volume. Without sampling, retention policies, and tiered storage, costs can spiral. Start with what matters. Expand as needed.
Q14: How does observability support AI operations?
AI agents generate telemetry traces of their reasoning, logs of their actions, metrics of their performance. Observability provides the visibility needed to monitor, debug, and improve AI systems in production.
Q15: Why should I choose Innovative AI Solutions?
Because we build systems with observability from the start. Because we understand that finding problems faster is a competitive advantage. Because we've delivered 100+ projects. Because your code is always yours.
Contact Us
Phone:
+91 7464 099 059
+91 9689967356
Email:
info@innovativeais.com
Address:
9th Floor, Pearls Best Heights-I,
Head Office: 904, Netaji Subhash Place,
Delhi – 110034